
In case you tune out the financial news, you may have missed the S&P 500 recently posted an all-time high.
Considering all the noise around tariffs, interest rates, unemployment, and geopolitics - that’s an impressive performance. Torsten Slok, Apollo Chief Economist, created the charts below using the compelling data behind this headline – Steady Wins the Race. Alongside Slok’s inspired charts, we’ve included our own take to further explore what this data means for investors navigating today’s complex economic landscape.
Comparative Analysis of Steady vs. Dynamic Companies
I wanted to share some eye-opening charts that compare the long-term performance of three dynamic, high-profile companies with three traditionally steady—but often overlooked—ones.
First up: Tractor Supply vs. Apple. In the first chart, the green line represents Apple’s market performance, while the blue line shows Tractor Supply. Surprisingly, over nearly 25 years, their performance has been remarkably similar.
.png)
Next, we compare Domino’s Pizza and Google. In this chart, Google is shown in green and Domino’s in blue. Once again, despite vastly different industries and public perception, their long-term performance is closely aligned.
.png)
Finally, we look at Old Dominion Freight Line vs. Amazon. Amazon is represented by the green line, and Old Dominion by the blue line. The trend continues—what many might consider a “steady” company has kept pace with one of the most transformative tech giants.
.png)
These comparisons highlight a powerful insight: sometimes, the so-called “steady” companies can deliver just as much long-term value as the flashier names.
Takeaways and Market Risks
So, what’s the takeaway? While tech stocks often dominate headlines with their innovation and growth potential, many lesser-known companies have delivered strong, stable returns—often with significantly less volatility. This highlights the importance of looking beyond the hype.
At the same time, today’s tech valuations raise important concerns. Yes, AI is poised to transform productivity and reshape our daily lives—but are current tech stock prices truly justified? For example, Tesla trades at nearly 200 times earnings, Nvidia around 60 times, and many software companies face existential threats from technologies like ChatGPT.
It’s unclear whether today’s most prominent tech names are the best way to invest in the AI revolution. More concerning, the current market environment bears a striking resemblance to the late 1990s tech bubble—a reminder to stay grounded in fundamentals.
Historical Parallels and Lessons
In the chart below, the green line shows the performance of the S&P 500 from 1996 through the early 2000s—just before the tech bubble burst. This period, often referred to as the “Roaring ’90s,” saw the S&P 500 deliver impressive, annualized returns of around 18% over a decade.
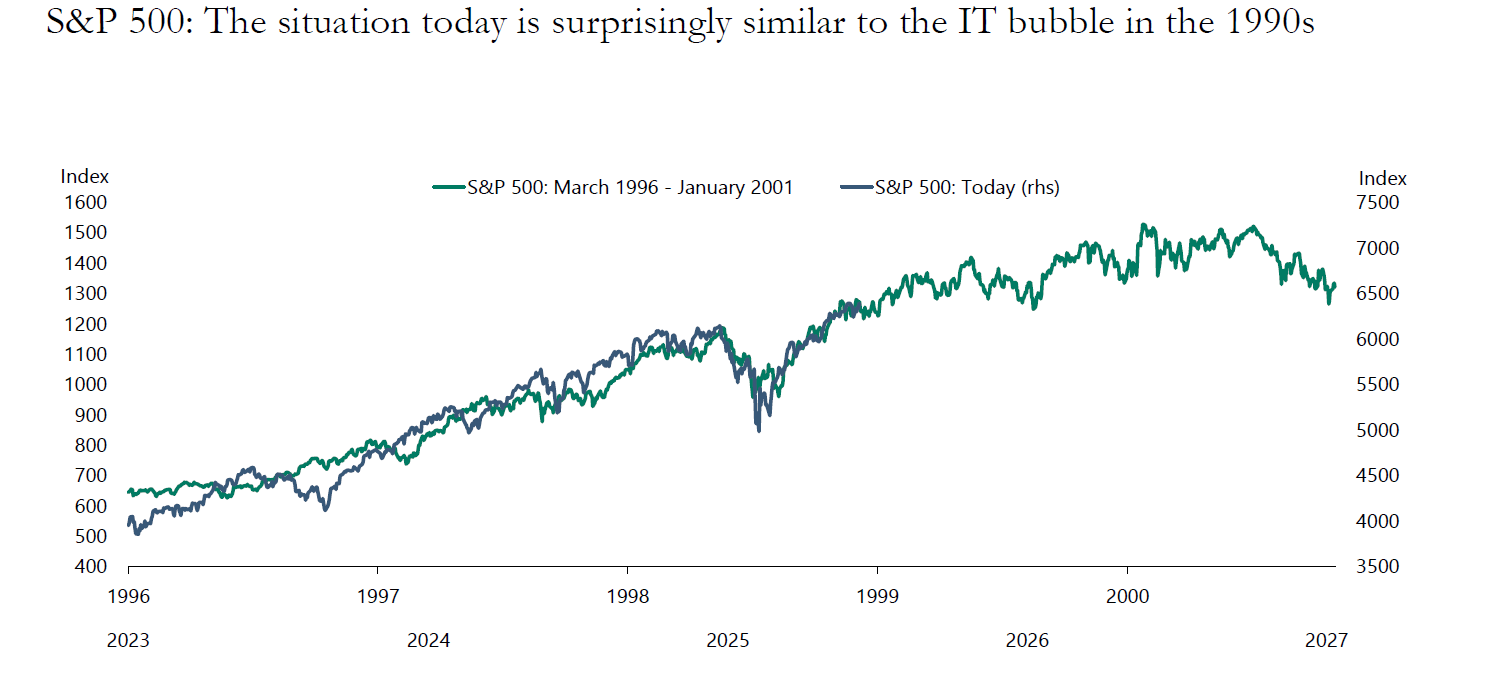
The blue line reflects the S&P 500 from 2023 to today, and the similarities are striking. While we can’t predict market timing and the AI-driven rally may continue for months or even years, the parallels are worth noting.
There are important lessons from the past. Many investors either forget—or never experienced—what followed the dot-com crash: a brutal “lost decade” stretching from 2000 through the Great Financial Crisis of 2007–2009. During that time, the S&P 500 underperformed 30-day Treasury bills, posting negative annualized returns.
Behavioral Biases and Investment Strategy
Since 2010, the S&P 500 has delivered strong double-digit returns, outperforming nearly every other market sector. This success, however, can lead to a behavioral trap known as recency bias—the tendency to overweight recent performance while undervaluing long-term historical data.
During bull markets, recency bias often manifests in several ways:
• Abandoning conservative strategies in favor of high-risk investments based solely on recent returns.
• Chasing trending sectors and so-called “hot” investments.
• Concentrating investments at market peaks when optimism is highest.
These behaviors can undermine long-term financial goals and expose portfolios to unnecessary risk.
The Value of Discipline
While chasing the latest market trends can be exciting, investors focused on long-term wealth building often find that consistent, disciplined strategies outperform speculative approaches over time.
It’s natural to feel a fear of missing out—especially when friends are sharing their latest tech stock picks. But remember, your investment strategy is designed to support your retirement, your children’s education, and your legacy. Companies with strong fundamentals, predictable cash flows, and dividend payouts may not make headlines, but they help you sleep well at night.
Portfolio Recommendations
This doesn’t mean avoiding technology or innovation—it means allocating wisely. A well-diversified portfolio might include some tech exposure, balanced with sectors like utilities, consumer staples, healthcare, and international investments.
The key is balance, not betting everything on the latest trend. If you’re feeling the urge to chase performance, consider setting aside an amount of money you can afford to lose—for a “speculation fund.” This allows you to participate in exciting trends while keeping enough money invested in a disciplined, long-term strategy to meet your must-have objectives and expand your freedom.
The foundation of prudent investing lies in developing a comprehensive plan and a rebalancing schedule—then sticking to it, regardless of short-term noise. By staying disciplined, following an investment philosophy, and avoiding emotional decision-making, you position yourself for long-term success, even in uncertain markets. Patience Rewarded.